It started with WiFi presence detection. I had built a system that tracks which room everyone is in by scraping RSSI from my OpenWrt APs. It worked — but the room assignments kept flickering. Kitchen. Office. Kitchen. Office. Three times in ten seconds. The state machine was fine. The WiFi wasn’t.
My home network runs six OpenWrt APs across three floors, two SSIDs — Mercury on 5 GHz, Saturn on 2.4 GHz — all backed by 802.11r for fast roaming. From the outside, it looks like a proper mesh. From the inside, one phone was bouncing between access points 129 times in 24 hours.
I didn’t know this until I built the tool to see it.
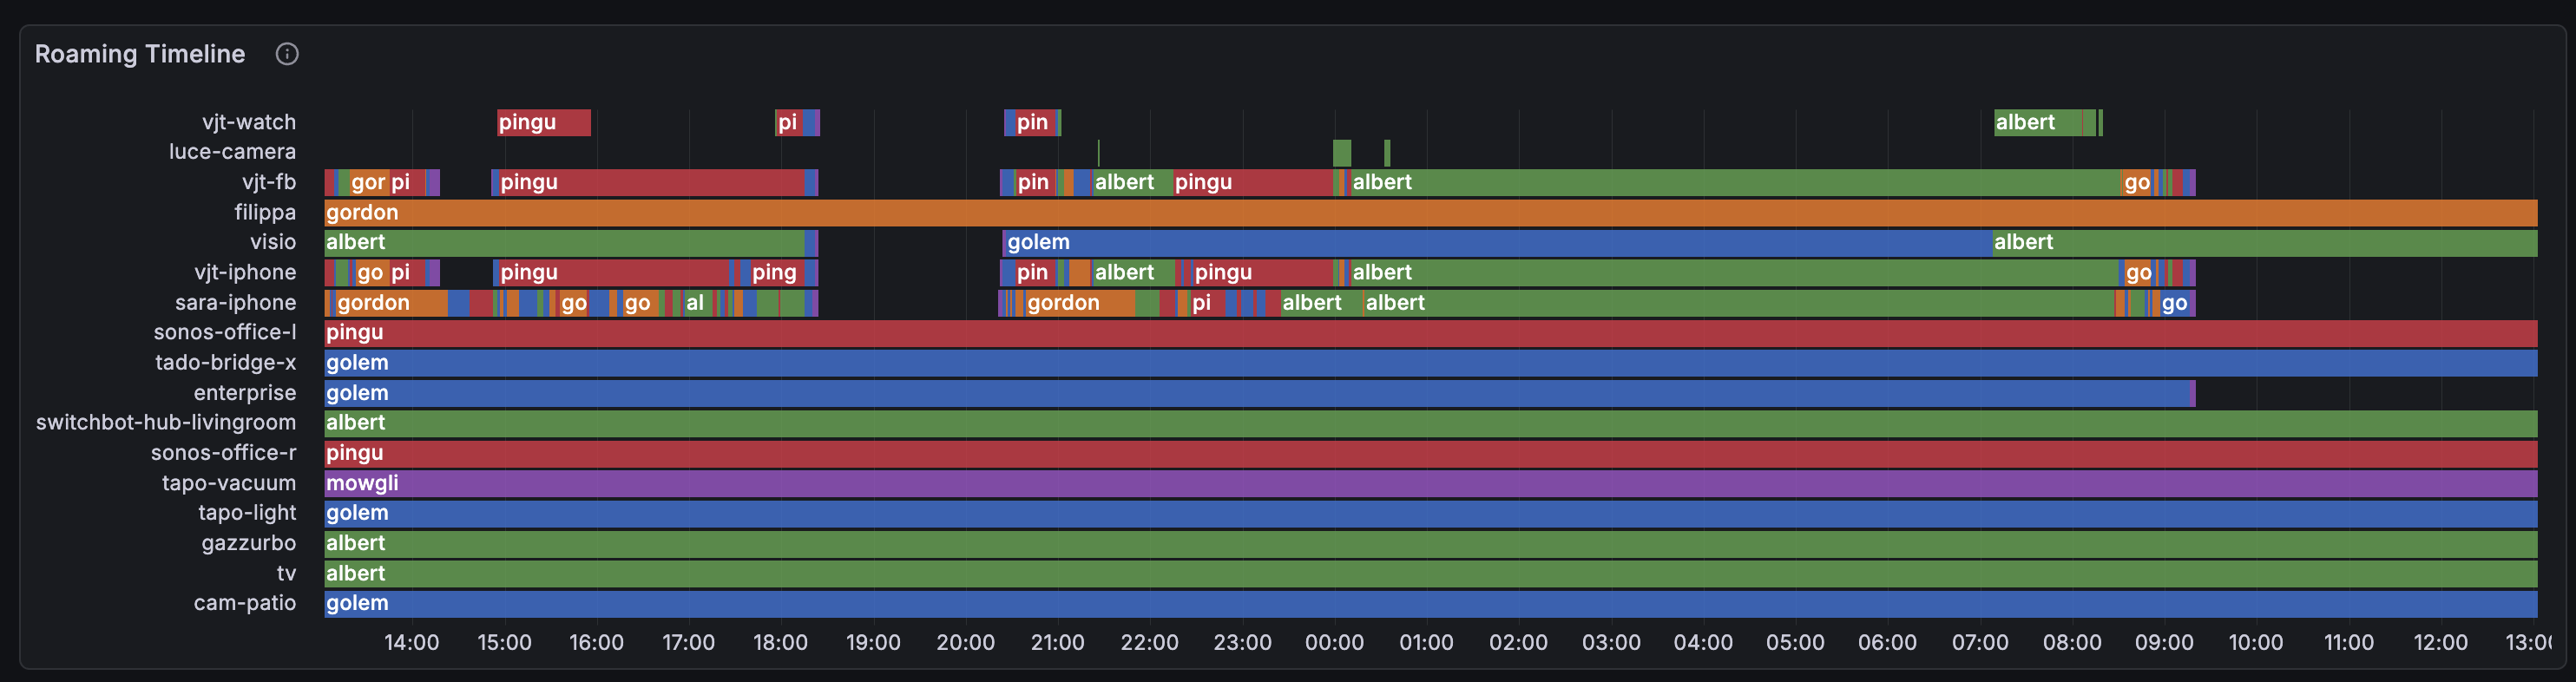
Each row is a WiFi client, the color shows which AP it’s connected to. Healthy clients show long solid bars. Sick ones look like barber poles. See sara-iphone? That rainbow stripe is 129 connects in 24 hours — the phone is walking through an overlap zone between two APs where both have roughly equal (and terrible) signal.
The Problem You Can’t See
WiFi roaming is invisible. Your phone shows full bars, Netflix buffers for a moment, and you blame the internet. But what actually happened is your phone disconnected from one AP, scanned for alternatives, picked another one with a marginally different signal, associated, authenticated, and started streaming again — all in under a second if 802.11r is working, several seconds if it’s not.
Do this 15 times in 2 minutes between two APs that both have garbage signal, and you get what I call thrashing: rapid, pointless AP bouncing that kills throughput and wastes airtime.
The problem is that none of the standard tools show this. iwinfo shows you a snapshot. logread shows individual events. But to see the pattern — which clients are bouncing, between which APs, how often, and why — you need to correlate data across time, across APs, and across data sources.
The Collection Pipeline
Before we get to the tool itself, a word on the infrastructure it depends on. All my OpenWrt APs ship metrics and logs to a lightweight SIEM stack running as four Docker containers on a Raspberry Pi 5:
- Telegraf — the central collector. Scrapes Prometheus metrics from each AP’s
node-exporter-lua, receives syslog fromhostapdanddnsmasq, enriches log lines through anexecdprocessor plugin, then routes metrics to VictoriaMetrics and logs to VictoriaLogs. - VictoriaMetrics — time-series database for all Prometheus metrics (RSSI, txpower, noise, usteer hearing data, station names). Lightweight, single-binary, handles tens of thousands of series on a Pi without breaking a sweat.
- VictoriaLogs — log storage for hostapd connect/disconnect events, DNS queries, and Docker container logs. Same VictoriaMetrics lineage, same efficiency.
- Grafana — dashboards and visualization, with the VictoriaLogs datasource plugin for log panels.
The stack also depends on Technitium DNS running as the network’s authoritative DNS and DHCP server. Its reserved leases API is what maps MAC addresses to hostnames — the glue that turns opaque hardware addresses into human-readable device names throughout the pipeline.
My presence detection system originally queried metrics through this stack, but the latency was too high for real-time room tracking — so it now scrapes each AP directly. The SIEM stack remains the backbone for historical analysis and dashboards. I’ll write about the SIEM setup itself in a future post — for now, just know that metrics and logs flow from the APs to this stack, and wifi-dethrash queries it.
The Tool
I built wifi-dethrash as a pipeline with four components:
1. Lua Collector — deployed on each AP as a prometheus-node-exporter-lua collector. Exports radio metrics (txpower, channel, frequency), UCI wireless config (802.11r/k/v status, configured txpower), and usteer runtime data (hearing map, roam events, channel load, associated clients). Uses nixio for DNS resolution with a module-level cache so we don’t shell out to nslookup every 5 seconds.
2. Go Station Resolver — a small binary (cmd/station-resolver) with two jobs. First: it sits in the Telegraf pipeline as an execd processor, reading Influx line protocol on stdin and enriching hostapd connect/disconnect events with a station=<hostname> field resolved from DHCP reserved leases. Second: it serves a /metrics endpoint exposing wifi_station_name{mac, station} 1 gauges that Telegraf scrapes and forwards to VictoriaMetrics. This is what makes the dashboard fully dynamic — no baked-in MAC-to-hostname mappings, no re-pushing the dashboard when a new device joins.
3. Python Analyzer — the wifi-dethrash CLI tool. Queries VictoriaMetrics for RSSI, noise, and txpower data, queries VictoriaLogs for hostapd connect/disconnect events, then runs three analyzers: thrashing detection (3+ alternating connects between exactly 2 APs within a time window), RSSI overlap analysis (concurrent readings from the same client on multiple APs within a threshold), and weak association detection (low SNR). Finally, the recommender cross-references thrashing pairs with overlap data and proposes txpower changes. It also checks 802.11v status and flags APs where it’s missing.
4. Grafana Dashboard — 13 panels generated programmatically by the Python tool, either as a JSON file for import or pushed directly via the Grafana API. All MAC addresses resolved to hostnames dynamically via group_left(station) joins against wifi_station_name_gauge.
Data Flow
[OpenWrt APs]
  ├─ prometheus-node-exporter-lua ──► Telegraf ──► VictoriaMetrics
  │   (wifi_station_signal_dbm, wifi_radio_txpower_dbm,
  │    wifi_usteer_hearing_signal_dbm, ...)
  │
  └─ syslog (hostapd events) ──► Telegraf ──► station-resolver ──► VictoriaLogs
      (AP-STA-CONNECTED <mac> auth_alg=ft)
                                     │
                                     └─► /metrics ──► Telegraf ──► VictoriaMetrics
                                         (wifi_station_name{mac,station} 1)
What the Dashboard Shows
The dashboard is designed to answer one question: is my mesh healthy, and if not, why?
Roaming Timeline
The 3-day view makes the thrashing pattern even clearer — you can see it’s not a one-off, it’s a daily cycle tied to people moving through the house:
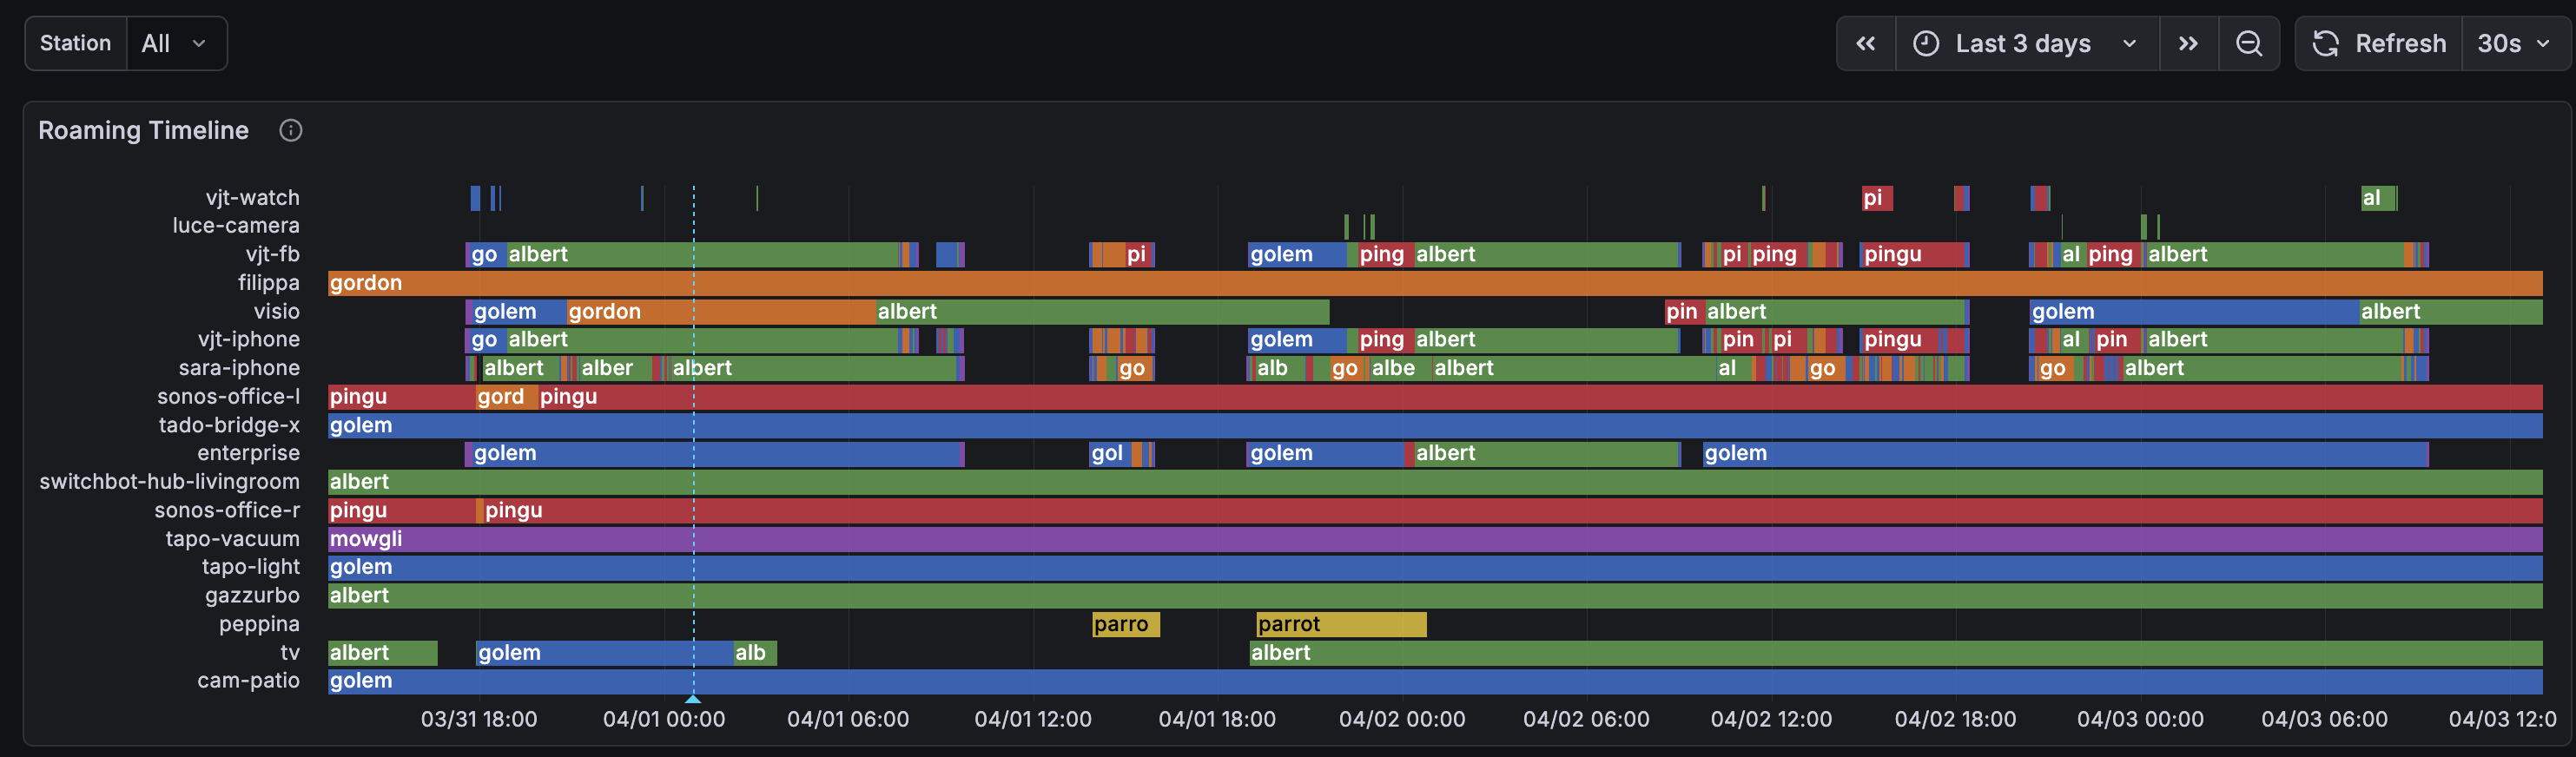
Compare the phones (chaotic rainbow stripes) with the IoT devices at the bottom — cam-patio, gazzurbo, tado-bridge — long solid bars, stable associations. Stationary devices that found their AP and stayed there.
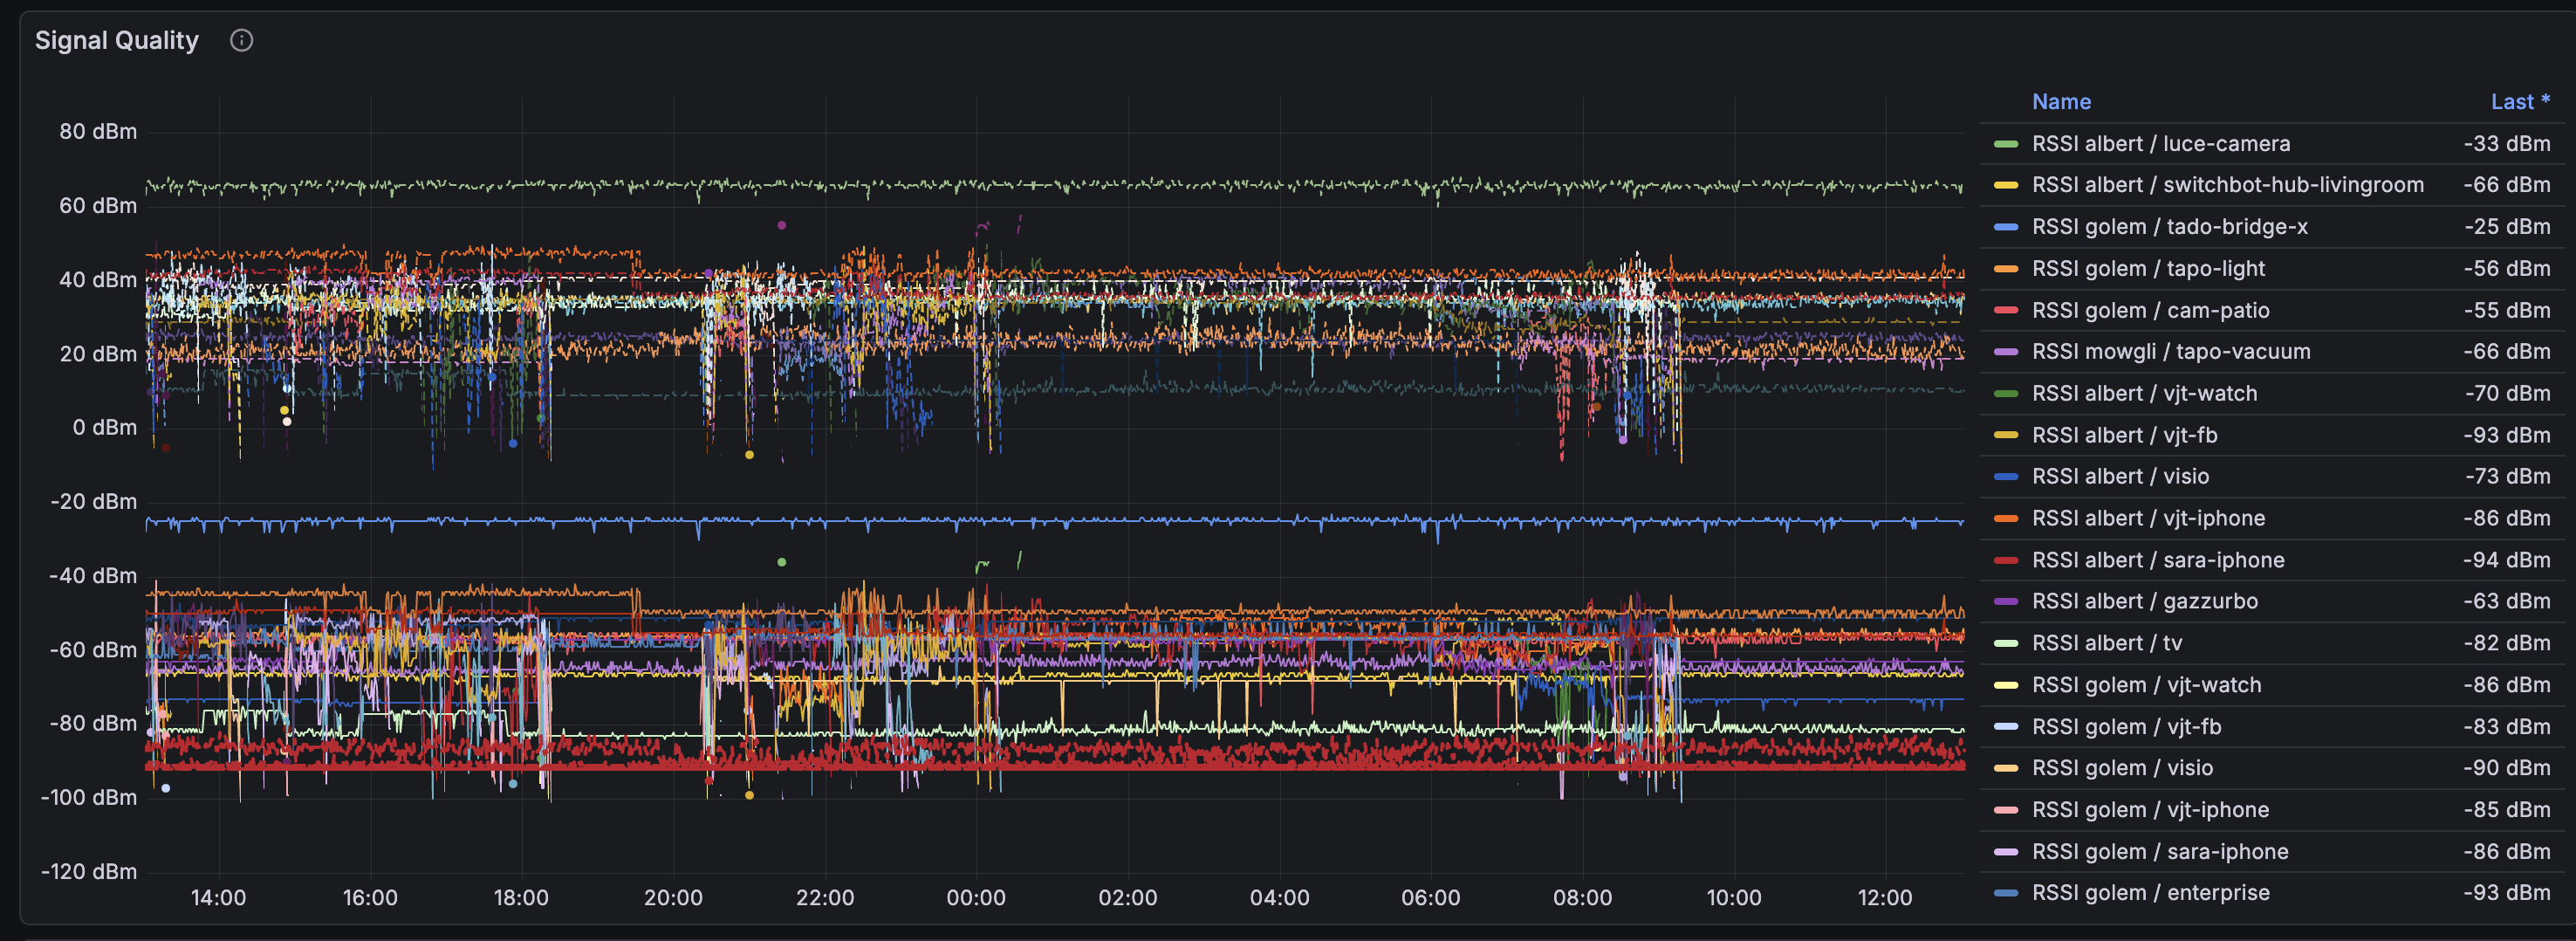
Signal Quality
RSSI, SNR, and noise floor for all stations. The horizontal red lines around -90 dBm are noise floor. Anything close to that line is a marginal connection.
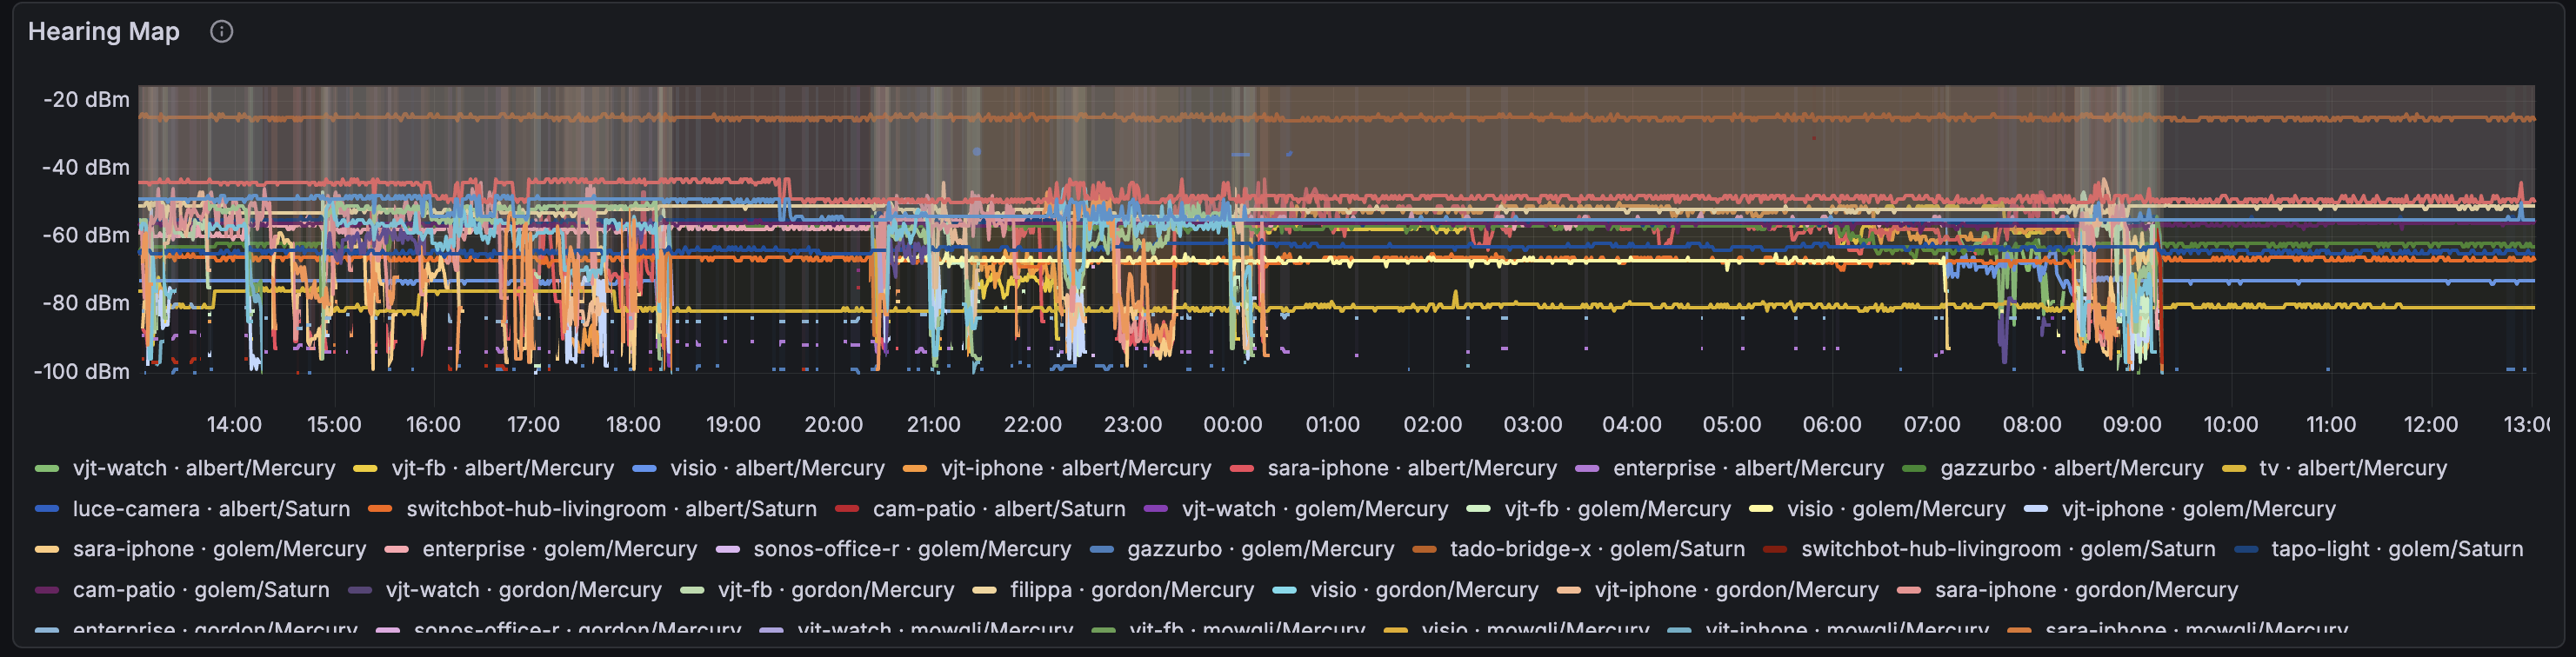
Hearing Map
This is usteer’s view of the world. Each line shows what signal an AP hears from a client — not just the AP the client is connected to, but all APs that can hear it. When multiple lines for the same client are close together, that’s an overlap zone.
FT vs Open Connects
How many roaming events used 802.11r Fast Transition (green) versus plain open authentication (yellow). FT roams are seamless — the client pre-authenticates with the target AP before switching. Open connects mean the client went through full association, which takes longer and can drop packets.
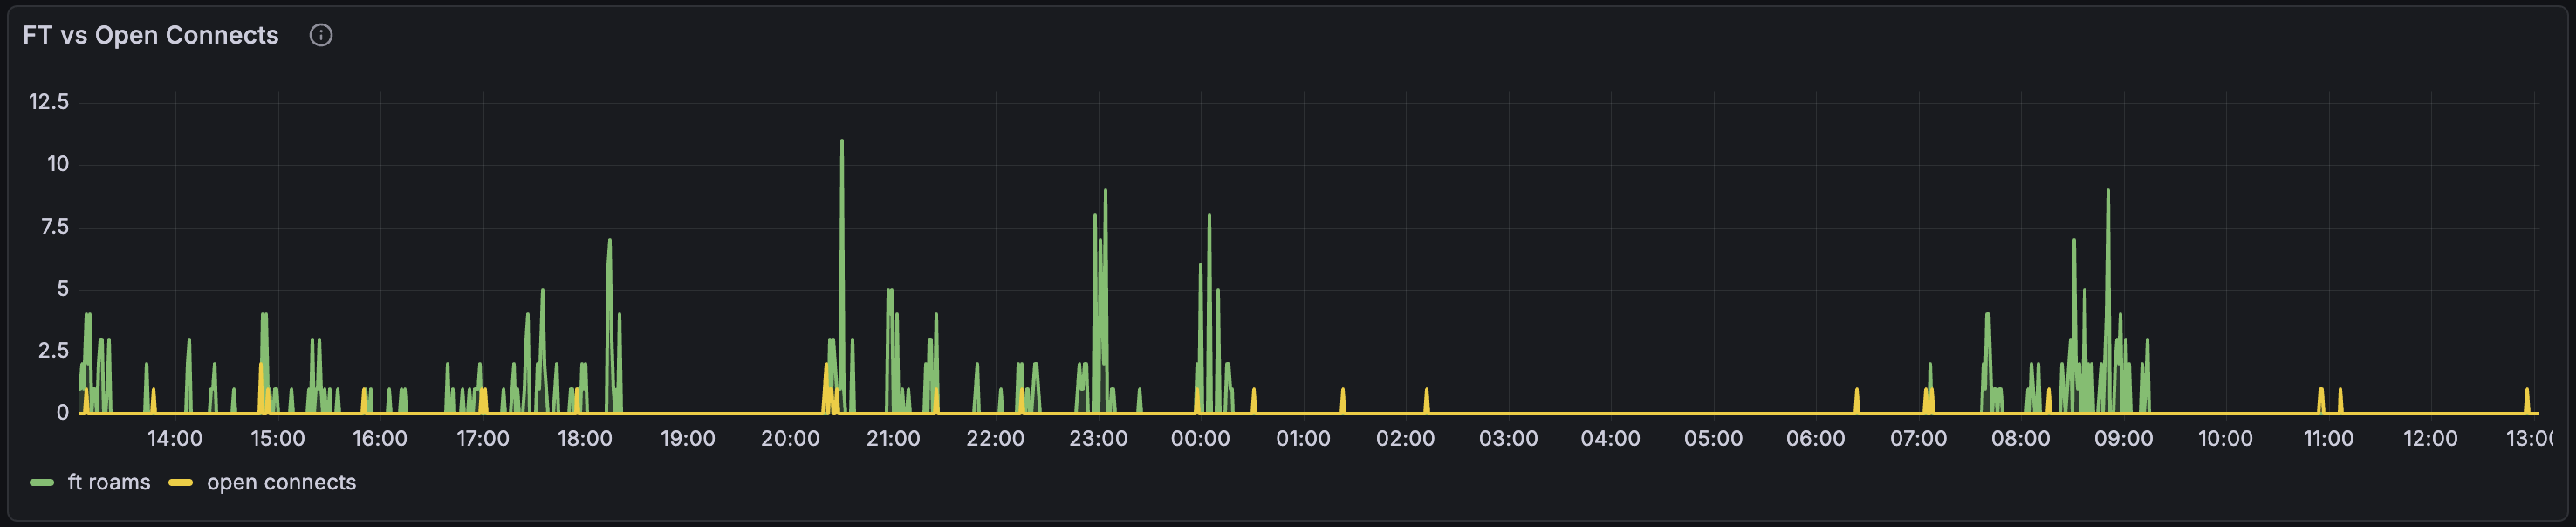
In my case, 82% of roams use FT — 802.11r is working. The yellow bars are mostly IoT devices that don’t support 802.11r, and one ancient AP running OpenWrt 19.07 that doesn’t support it either.
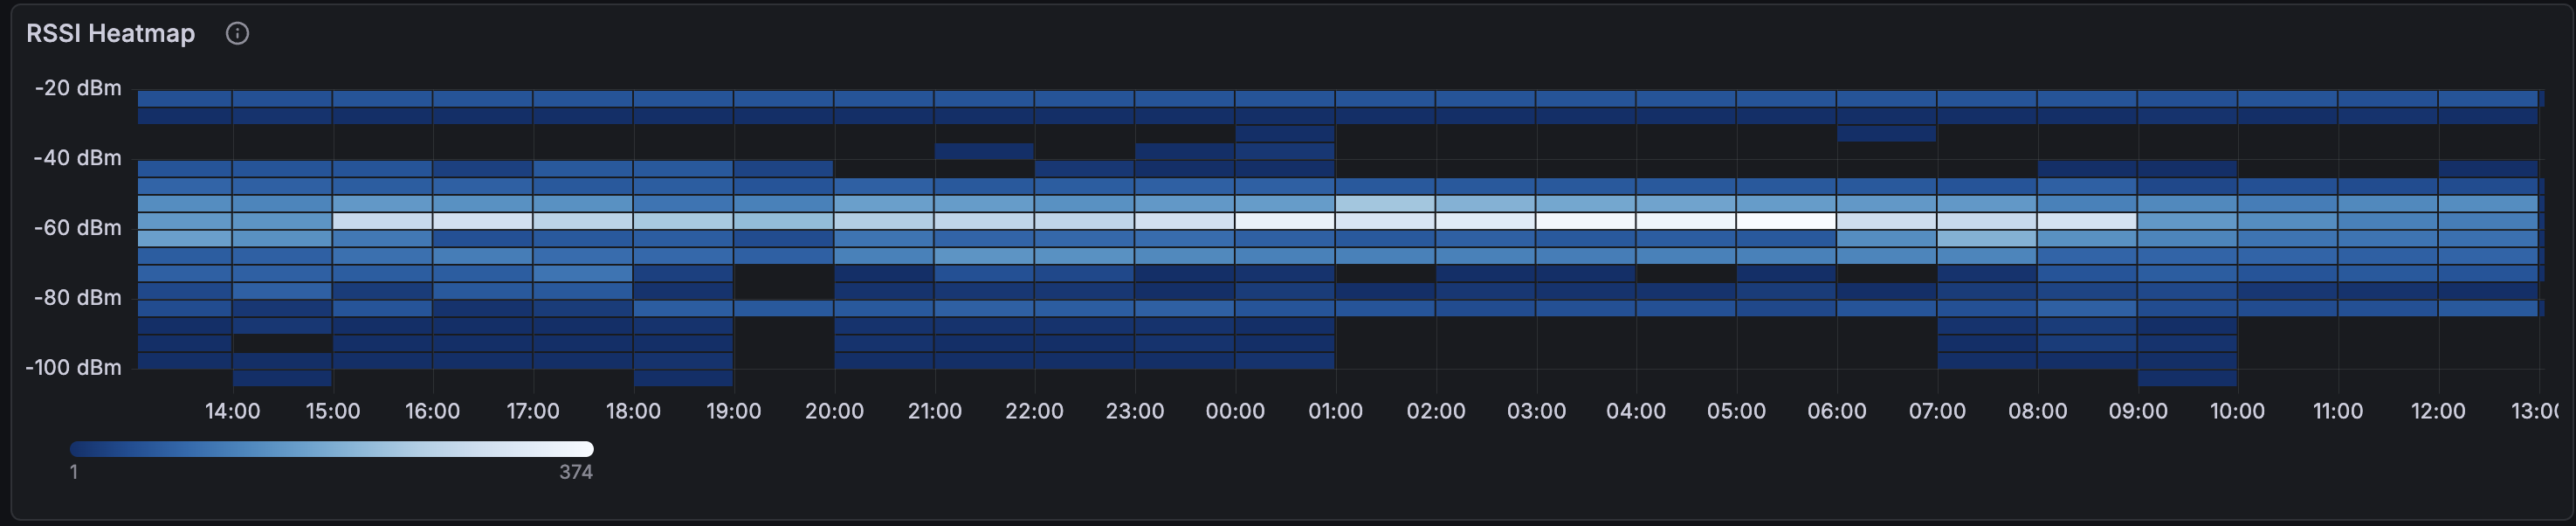
RSSI Heatmap and Config Panels
The heatmap shows the distribution of signal strengths across all clients over time. The bright band around -60 to -70 dBm is where most associations live. The fainter bands below -80 are the trouble zone.
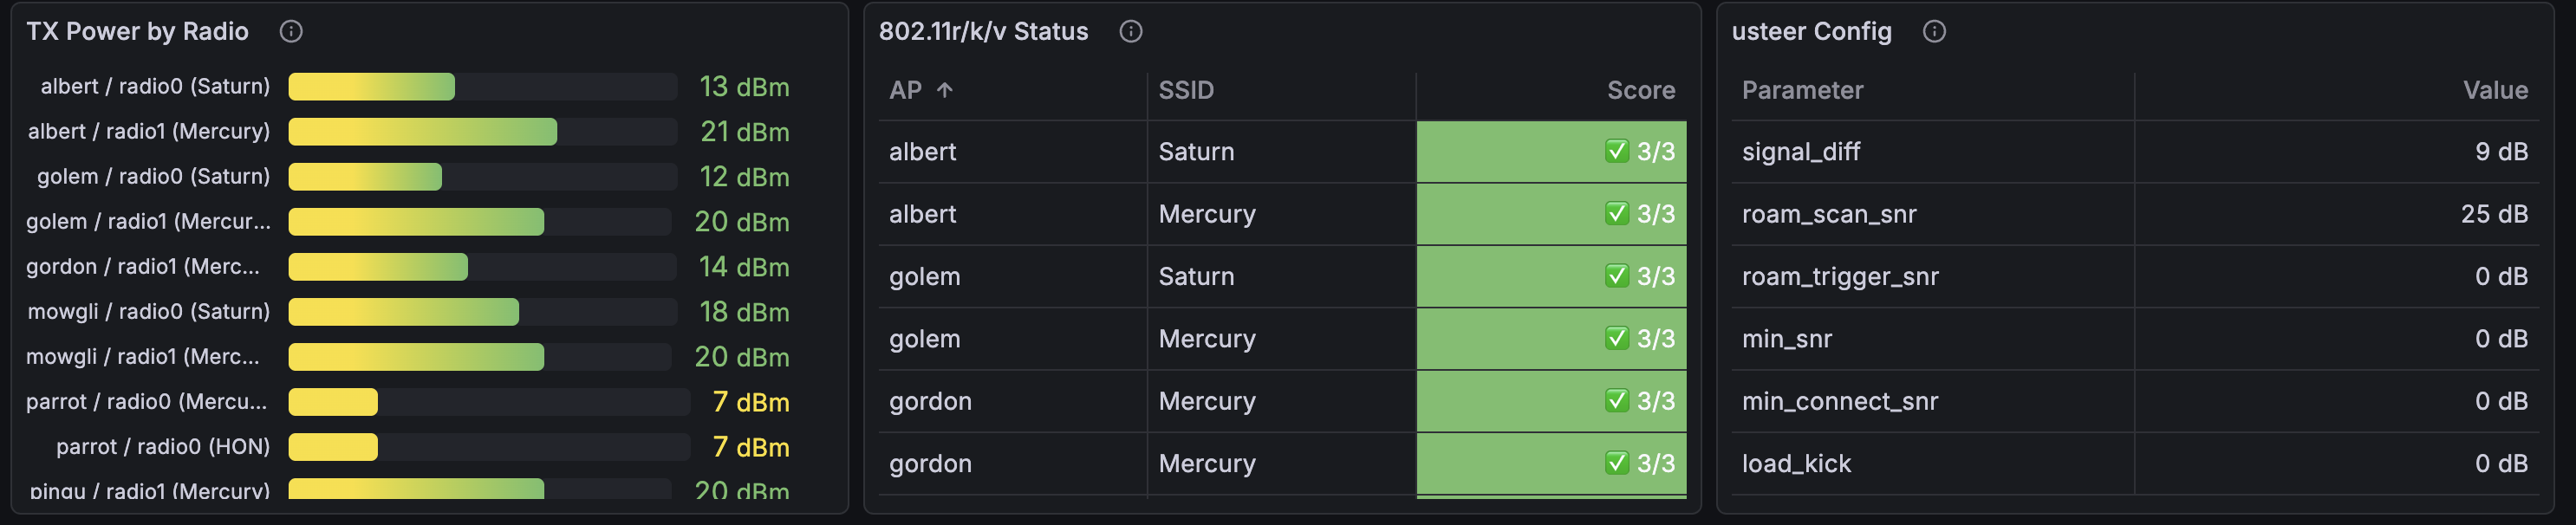
The config panels show txpower per radio, 802.11r/k/v status, and usteer thresholds at a glance:
The CLI Analyzer
The Grafana dashboard is for monitoring. The CLI tool is for diagnosis and action. Running wifi-dethrash --window 3d produces a report like this:
Got 120606 RSSI readings, 2202 hostapd events, 19 MAC names.

                      Thrashing Summary
 Station        AP Pair         Connects  Episodes
 sara-iphone    golem ↔ pingu       103        13
 vjt-iphone     golem ↔ pingu        29         6
 vjt-iphone     albert ↔ pingu       11         2
 vjt-fb         albert ↔ pingu       10         3
 ...

                    RSSI Overlap (significant)
 Station        AP Pair        Avg Diff  Samples       RSSI
 sara-iphone    golem ↔ pingu    3.4 dB  74/203  -84/-84 dBm
 ...

                       Txpower Plan
 AP     Radio   Current  →  Proposed  Delta
 pingu  radio1    20 dB  →    22 dB    +2

  ssh root@pingu uci set wireless.radio1.txpower=22

usteer Configuration
  ssh root@<ap> uci set wireless.<iface>.ieee80211v=1
    # Enable BSS Transition Management — required for usteer to send roam hints
  ssh root@<ap> uci set usteer.@usteer[0].signal_diff_threshold=9
    # Don't roam unless new AP is 9+ dB stronger
  ...
It joins thrashing data with overlap data: a pair only gets a recommendation if there’s both thrashing (the phones are actually bouncing) and overlap (the RSSI from both APs is close enough to cause confusion). No false positives.
The recommender is opinionated. When both APs in a thrashing pair have weak signal (below -75 dBm), it recommends increasing txpower on the AP with more headroom — lower current power means more room to grow. It explicitly won’t increase an AP that’s already cranked to max. When signal is healthy but overlapping, it reduces the louder AP to create differentiation.
Roaming Coordinators: usteer, DAWN, and nrsyncd
OpenWrt has three options for coordinating roaming across APs, and it’s worth understanding the trade-offs.
DAWN (Decentralized WiFi Controller) was the original answer. It scores clients based on RSSI and channel load, and can deny probe/auth/association requests to force clients onto better APs. It’s been effectively abandoned — the last meaningful development is years old, and it doesn’t work reliably on recent OpenWrt releases. Not worth considering.
usteer replaced DAWN as OpenWrt’s recommended roaming daemon. It does neighbor report synchronization, hearing map sharing, and active client steering via BSS Transition Management (802.11v) frames. In theory, it’s the complete solution.
In practice, usteer has a reputation for being unreliable. Known issues include: roam_kick_delay not working, channel load steering never triggering, Intel WiFi cards ignoring BTM requests entirely, and soft-bricking reports on recent OpenWrt snapshots. The forum consensus leans toward “usteer tries to do too much and does none of it consistently well.”
nrsyncd takes the opposite approach: it only distributes 802.11k neighbor reports across APs via mDNS. No steering, no kicking, no policy decisions. It gives clients the information they need to make good roaming choices, then gets out of the way. Lightweight, focused, and hard to break.
What I’m Running
I’m currently using usteer, but with all the aggressive features disabled. The key settings:
signal_diff_threshold: only steer if the target AP is this many dB stronger. Set too low and you cause unnecessary roaming. Set too high and clients stay stuck on bad APs. I run 9 dB.roam_scan_snr: when a client’s SNR drops below this, usteer starts considering alternatives. I use 25 dB — it triggers scanning early without kicking anyone.min_snr/min_connect_snr/roam_trigger_snr: all set to 0 (disabled). These kick clients below the threshold, causing disconnect storms when clients are in weak-coverage areas with no better AP available. Ask me how I know.load_kick_enabled: disabled. Force-disconnecting clients under load is never the answer.
The philosophy: usteer should suggest, never force. Use signal_diff for gentle steering, disable everything that kicks.
But there’s a critical prerequisite: 802.11v (BSS Transition Management). Without it, usteer’s only tools are rejecting probe responses and blocking associations — both blunt instruments. With 802.11v enabled, usteer can send BTM frames: polite “hey, there’s a better AP over there” hints that the client can accept or ignore. Most modern devices (iPhones, recent Android) honor BTM requests.
The analyzer now checks 802.11v status via the wifi_iface_ieee80211v_enabled metric and flags APs where it’s missing. This was a bug we found in our own setup — usteer was enabled but couldn’t actually steer because 802.11v was never turned on.
The Verdict (Pending)
I’m giving usteer a fair trial. With 802.11v now enabled, it finally has the tools to do gentle BTM steering. If roam_events stays at zero and thrashing doesn’t improve over the next week, usteer is dead weight and I’ll switch to nrsyncd — same neighbor report distribution, none of the steering complexity that doesn’t work anyway.
What I Learned
WiFi roaming is a client-side decision. The AP can hint, suggest, or reject, but the client’s WiFi stack makes the final call. iPhones are aggressive roamers (sometimes too aggressive). IoT devices latch on and never let go. LG TVs are the worst — our TV kept connecting to an AP a floor away with SNR 14 instead of the one in the same room with SNR 21. The fix? An ethernet cable. Some problems don’t have WiFi solutions.
The overlap zone is where thrashing lives. If two APs have similar signal strength in a given area, clients will bounce between them endlessly. The fix is either increase one AP’s power (create a clear winner) or reduce the other’s (shrink its footprint). The tool’s txpower recommendations target exactly this.
Data beats intuition. I assumed my mesh was fine because “it works.” The dashboard showed otherwise: 129 roaming events, 73 bounces, 15 back-and-forth transitions in 2 minutes for a single phone. You can’t debug what you can’t see.
Current Status
We’re in observation mode. Recent changes:
- Bumped one AP’s 5 GHz txpower from 18 to 20 dBm to improve coverage in the overlap zone
- Enabled 802.11v on all APs so usteer can send BTM frames
- Fixed the recommender to make smarter txpower suggestions
- Wired the TV (100 Mbit ethernet beats flaky WiFi any day)
The 3-day roaming timeline shows the pattern is still present but potentially improving. More data needed.
Try It
The project is at github.com/vjt/openwrt-dethrash. You’ll need:
- OpenWrt APs with
prometheus-node-exporter-lua - A VictoriaMetrics + VictoriaLogs + Telegraf pipeline
- Grafana with the VictoriaLogs datasource plugin
- Python 3.12+ for the CLI tool
- Optionally, Technitium DNS for DHCP-based MAC resolution
The Lua collector, Go station resolver, and Python analyzer are all in the repo. The dashboard is generated programmatically — wifi-dethrash --push-dashboard creates all 13 panels with the correct datasource UIDs. Metrics are documented in the CLAUDE.md.
Happy hacking!